Abstract
Image-similarity metrics are widely used to assess synthetic data, yet it remains unclear whether they predict how effectively synthetic training data transfer to real images. We present a common evaluation protocol for appearance- and structure-oriented proxies and apply it to seven benchmark families, 21 dataset variants, and 87,880 image-pair comparisons spanning object detection, semantic segmentation, and 6D pose estimation. No standalone metric is consistently strongest: appearance metrics are more informative in settings dominated by rendering, texture, or illumination differences, whereas correspondence-based metrics provide stronger evidence when pose, viewpoint, or spatial structure varies. These results show that the two signal families capture distinct aspects of synthetic-to-real compatibility.
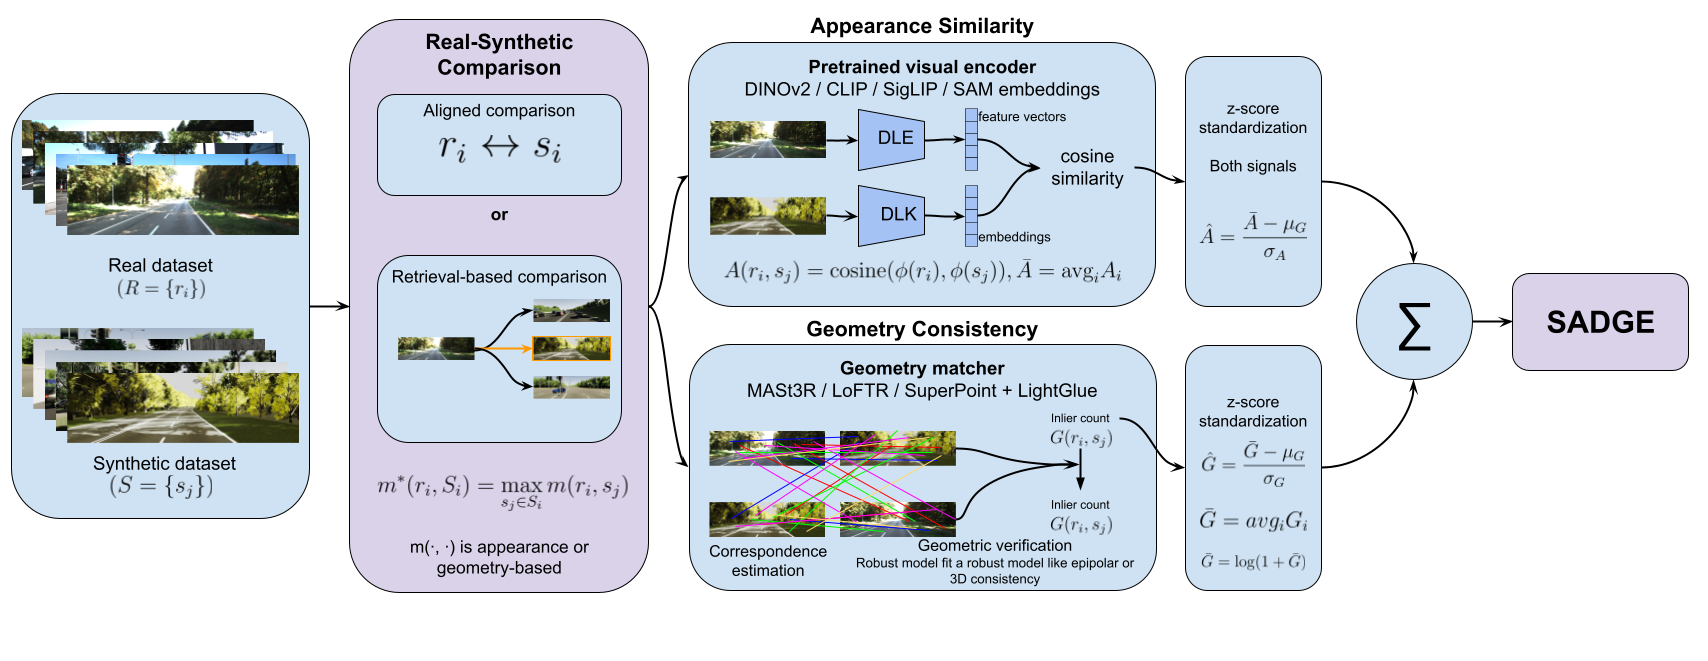
As a secondary analysis, we introduce SADGE, a transparent three-parameter interaction between DINOv3 appearance similarity and MASt3R correspondence. When fitted and evaluated on the complete benchmark, SADGE reaches Pearson r = 0.834 and Spearman ρ = 0.853, compared with r = 0.585 and 0.545 for the strongest appearance- and structure-oriented standalone metrics. Keeping DINOv3 and MASt3R fixed, we repeatedly fit SADGE on subsets of variants and evaluate it on the remaining variants. Median held-out Pearson correlation increases from 0.611 with three calibration variants to 0.755 with ten, exceeding the strongest unfitted metric from five calibration variants onward. Under exhaustive family-disjoint calibration, median held-out correlation rises from 0.529 with two calibration families to 0.841 with five, although the wider dispersion and negative tail reveal substantial sensitivity to calibration composition. Together, these analyses support evaluating appearance and structural compatibility jointly. SADGE requires calibration on known downstream results; scoring additional datasets then requires no downstream training.
The benchmark
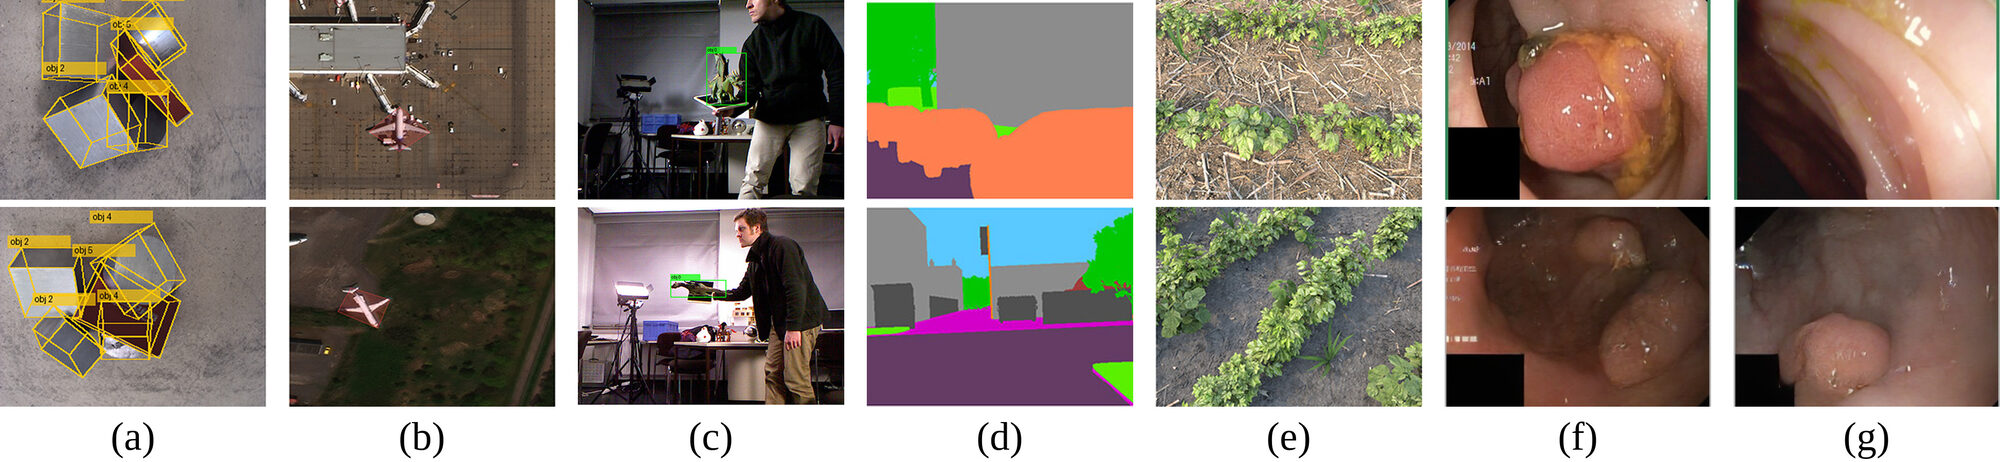
Seven public synthetic-to-real families, each with downstream results reported under one training and evaluation recipe, so variants within a family differ only in the synthetic source.
No standalone metric is consistently strongest
Correlation of each metric with downstream performance. Drop one family at a time and the best standalone metric changes, between appearance and structure.
Appearance and geometry together
SADGE is a three-parameter interaction between DINOv3 appearance similarity and MASt3R correspondence. Neither component alone orders the 21 variants as well as the two combined.
How far calibration carries
SADGE needs calibration data with known downstream results. Fitted on part of the benchmark and scored on the rest, it overtakes the unfitted metrics, with wide spread when whole families are held out.
Acknowledgments


This work was supported by the European Union through the EOSC-ARENA project (AI Research Enhancement through Networked Agents), Grant Agreement No. 101292597.
The authors thank Poznańskie Centrum Superkomputerowo-Sieciowe (PCSS) for providing the computational resources used in the experiments.
BibTeX
@misc{bartkowiak2026sadgestructureappearancedomain,
      title={Auditing Metrics for Synthetic Data Utility: A Cross-Domain Study of Appearance and Geometry},
      author={Patryk Bartkowiak and Dominik Michels and Sören Pirk and Wojtek Palubicki},
      year={2026},
      eprint={2605.22467},
      archivePrefix={arXiv},
      primaryClass={cs.CV},
      url={https://arxiv.org/abs/2605.22467},
      note={WACV 2027}
}